Daniel Bergey
Daniel learned to program at his mother’s knee, and has been coding off and on since, usually while he should be doing something else. He began teaching by showing adults how to double-click on a Mac. In school he learned to draw straight lines and talk about art. More recently he’s been using sensors, Python, and graphs to understand the physics and energy use of buildings. He’s interested in open hardware beyond microelectronics and 3D printers, and in Free software for design. He can be reached at bergey@teallabs.org
Portfolio
PA School District Expenditures - Interactive Web Graphs (2014)
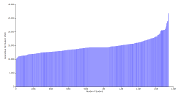
My school districts project graphs data from the PA Department of Education on per-student expenditures for each district in the state. I wanted to understand how the Philadelphia school budget compares to the rest of the state. I like interactive web graphs because they are easy to share, and allow some middle ground between the exploratory and explanatory tendencies in data visualization. The project is implemented in Javascript using D3, and is available on github.
Pandoc RST Reader (2014)
I improved pandoc’s support for RST, including adding support for class directives, warnings about unknown syntax, and improved custom roles. Class directives are converted to HTML as a div tag with the specified class(es). Custom roles are similar, for inline elements instead of block; in other words, they become span tags in HTML. I’m mostly interested in both features as a way to mark particular document elements for special processing by filters (like diagrams-pandoc, below). There are more details in the release notes.
diagrams-pandoc - Pandoc Filter for Vector Graphics Language (2014)
I wrote the initial version of diagrams-pandoc, a filter to convert Haskell code in markdown or other pandoc-readable formats into images in the final output. diagrams-pandoc is now collectively maintained by the Diagrams team. I hope that this filter will make it easier for people to include Diagrams in their documents, especially when writing for the web, and also encourage more people to use Diagrams.
Finger-Jointed Box - Laser Cut from Parametric Design in Haskell (2013)
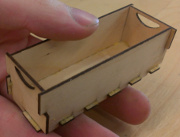
I laser cut the box at left from 1/16″ plywood, according to a parametric design modeled in Diagrams. The design is easily modified to arbitrary box dimensions and joint sizes. I also help maintain the Diagrams library for 2D & 3D graphics in Haskell.
Metafont in Haskell - Spline Interpolation in Diagrams (2013)
https://github.com/diagrams/diagrams-contrib/pull/16
Berrybasket - Networked Datalogger (2013)
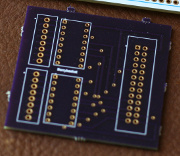 Berrybasket measures up to 14 analog voltage sensors, and uploads the data to a server, so that it can be viewed in near-realtime. The project grew out of my field monitoring of buildings, where it is inconvenient to frequently visit to collect data, but where a system failure between visits can result in months of missed data. We used the board in Philadelphia classroom, and presented a poster about it at the Open Hardware Summit in 2013.
The hardware and software are described on the project website, along with links to the source code and PCB design. I also wrote a bit more about the process here.
Resume (pdf)
Publications
Armin Rudd and Daniel Bergey. Ventilation System Effectiveness and Tested Indoor Air Quality Impacts. Building Science Corporation, 2013. pdf
A. Rudd, H. Henderson, D. Bergey, D. Shirey. RP-1449: Energy Efficient and Cost Assessment of Humidity Control Options for Residential Buildings. ASHRAE, 2012. (PDF behind paywall)
Daniel Bergey and Kohta Ueno. “New England Net Zero Production Houses,” ASHRAE Transactions 117(2) (2011). (pdf)